Creates a heatmap visualization of elevation data. This function provides a
quick way to visualize the terrain in your area of interest.
Usage
plot_elevation(elevation = NULL, low_color = "darkblue", high_color = "white")
Arguments
- elevation
A raster object containing elevation data, as returned by get_elevation()
- low_color
Color for lowest elevations (default: "darkblue")
- high_color
Color for highest elevations (default: "white")
Value
A ggplot object that can be further customized using ggplot2 functions
Examples
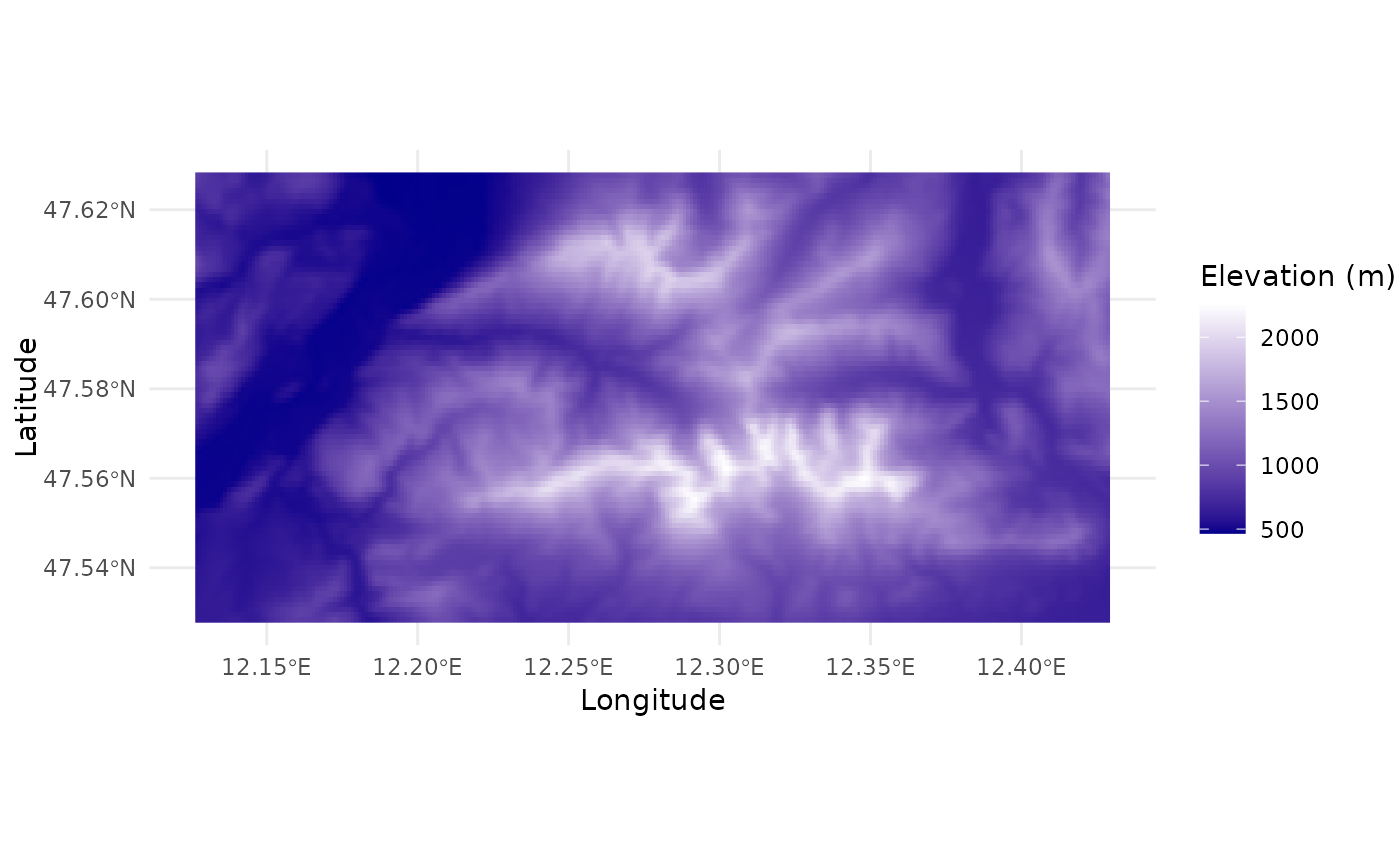
# Create a basic elevation plot
plot_elevation(ele_wilder_kaiser)
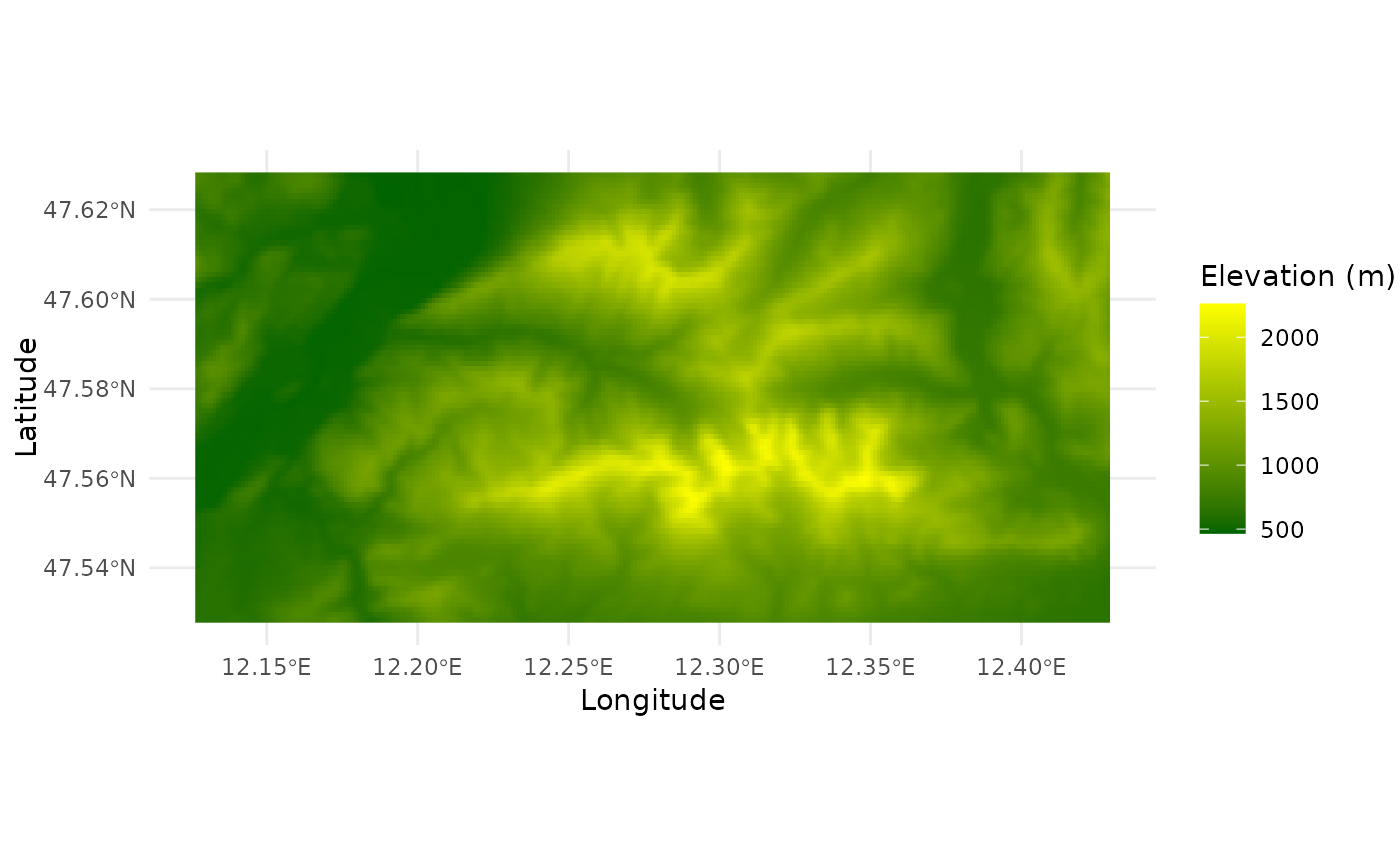
 # Customize colors
plot_elevation(ele_wilder_kaiser, low_color = "darkgreen", high_color = "yellow")
# Customize colors
plot_elevation(ele_wilder_kaiser, low_color = "darkgreen", high_color = "yellow")