Creates a visualization of elevation data using contour lines. This function provides a way to visualize terrain elevation changes through isolines.
Usage
plot_contours(
  elevation = NULL,
  interval = 100,
  line_color = "black",
  linewidth = 0.25,
  color_by_elevation = "none",
  low_color = "darkblue",
  high_color = "darkred",
  fill_alpha = 1
)
Arguments
- elevation
A raster object containing elevation data, as returned by get_elevation()
- interval
Elevation interval between contour lines in meters (default: 100)
- line_color
Color of the contour lines (default: "black")
- linewidth
Width of the contour lines (default: 0.25)
- color_by_elevation
How to color elevation: "none", "lines", "fill", or "both" (default: "none")
- low_color
Color for lowest elevations when coloring by elevation (default: "darkblue")
- high_color
Color for highest elevations when coloring by elevation (default: "darkred")
- fill_alpha
Alpha transparency for fill color (default: 1)
Examples
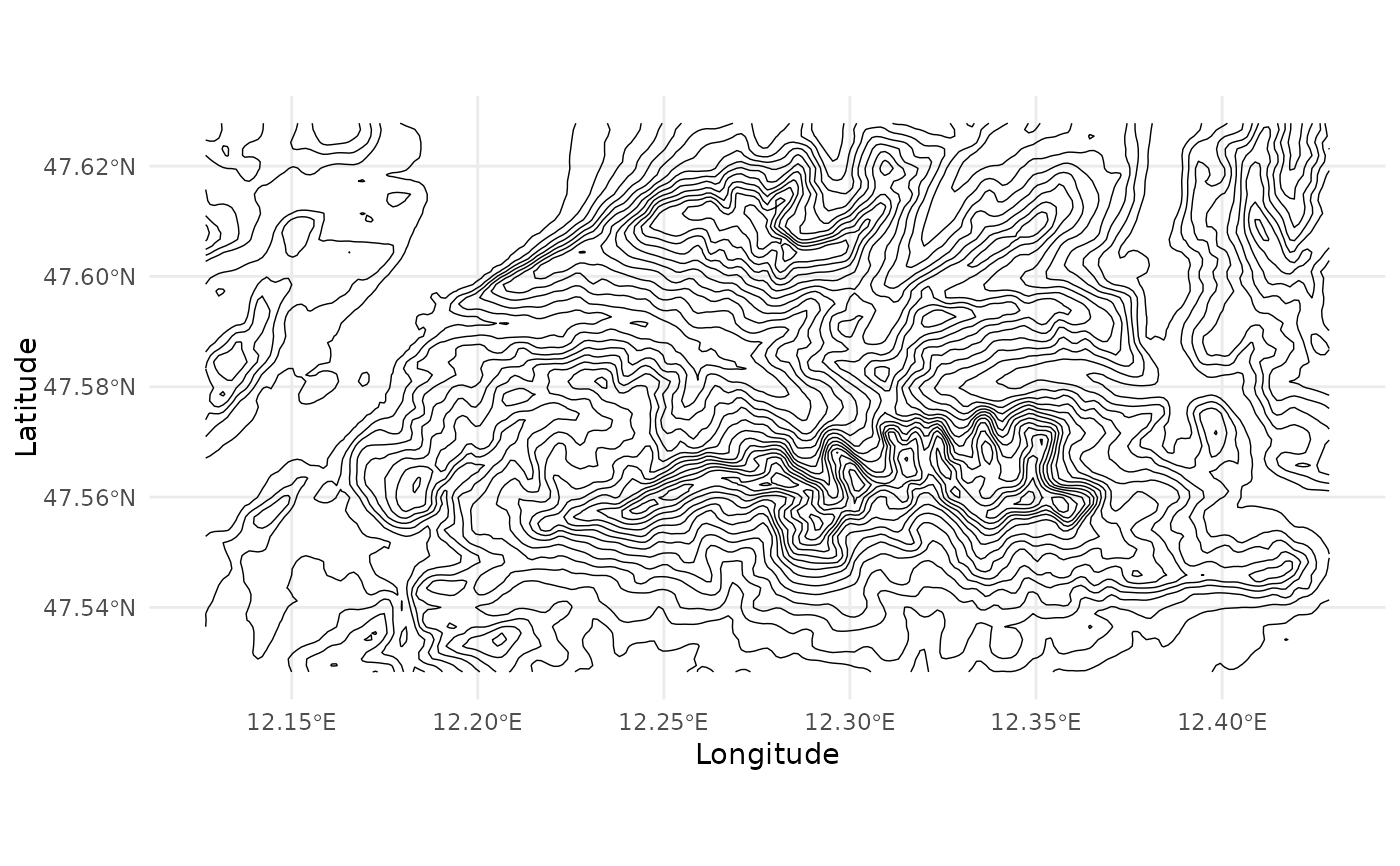
# Create a basic contour plot
plot_contours(ele_wilder_kaiser)
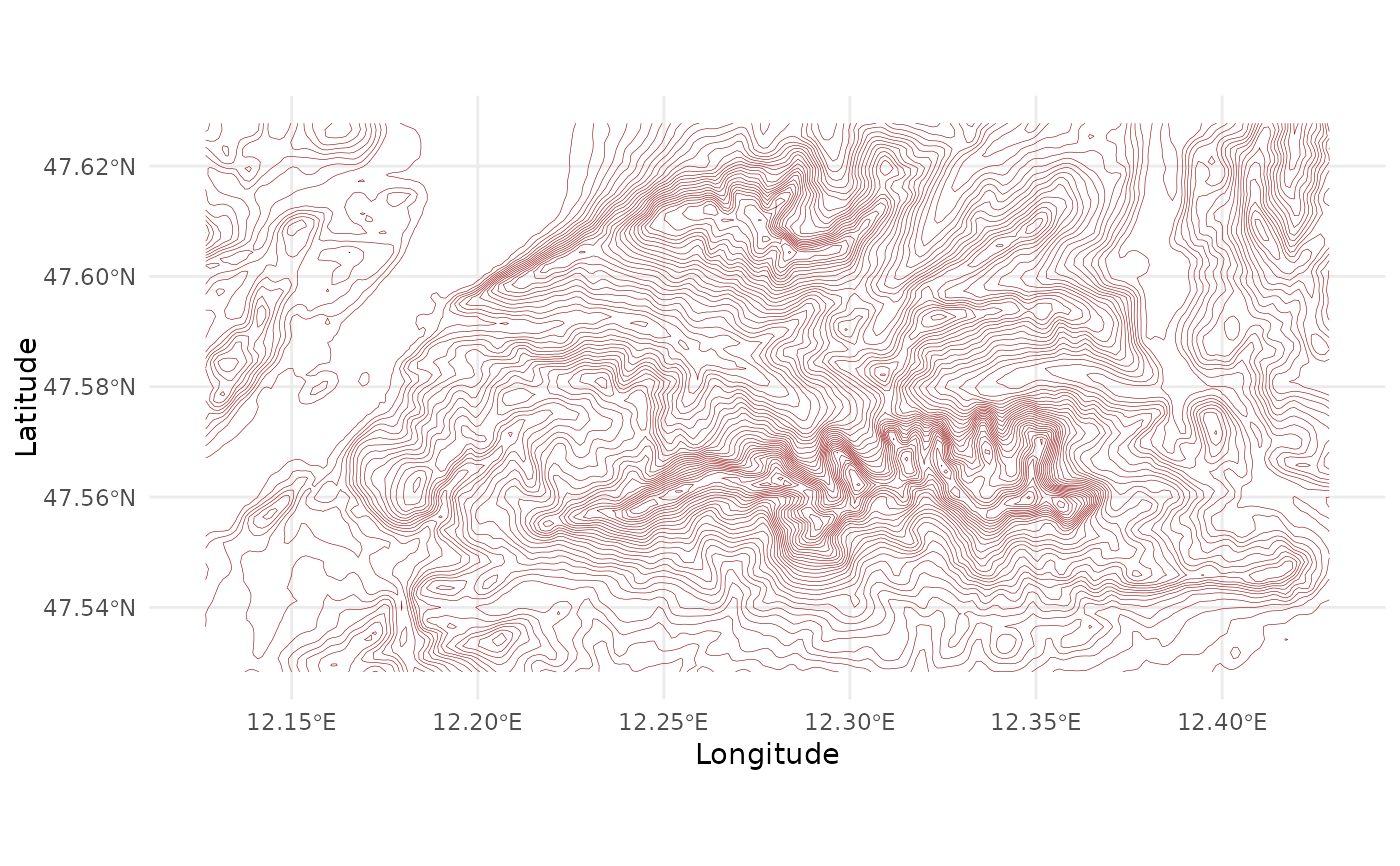
 # Customize contour interval and appearance
plot_contours(ele_wilder_kaiser,
interval = 50,
line_color = "darkred",
linewidth = 0.1
)
# Customize contour interval and appearance
plot_contours(ele_wilder_kaiser,
interval = 50,
line_color = "darkred",
linewidth = 0.1
)
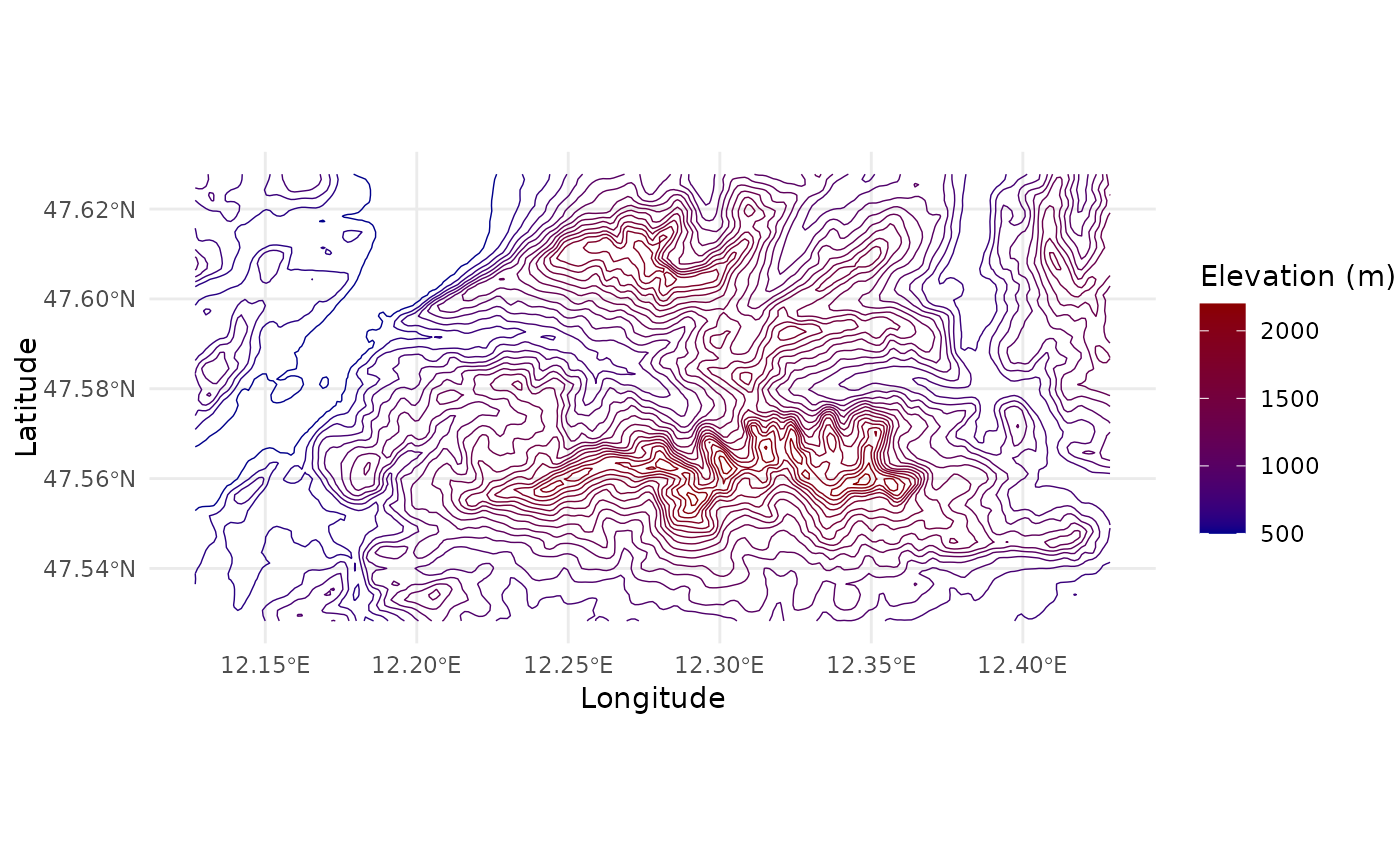
 # Color contours by elevation
plot_contours(ele_wilder_kaiser, color_by_elevation = "lines")
# Color contours by elevation
plot_contours(ele_wilder_kaiser, color_by_elevation = "lines")
 # Color fill by elevation
plot_contours(ele_wilder_kaiser, color_by_elevation = "fill")
#> Warning: `guide_colourbar()` needs continuous scales.
# Color fill by elevation
plot_contours(ele_wilder_kaiser, color_by_elevation = "fill")
#> Warning: `guide_colourbar()` needs continuous scales.
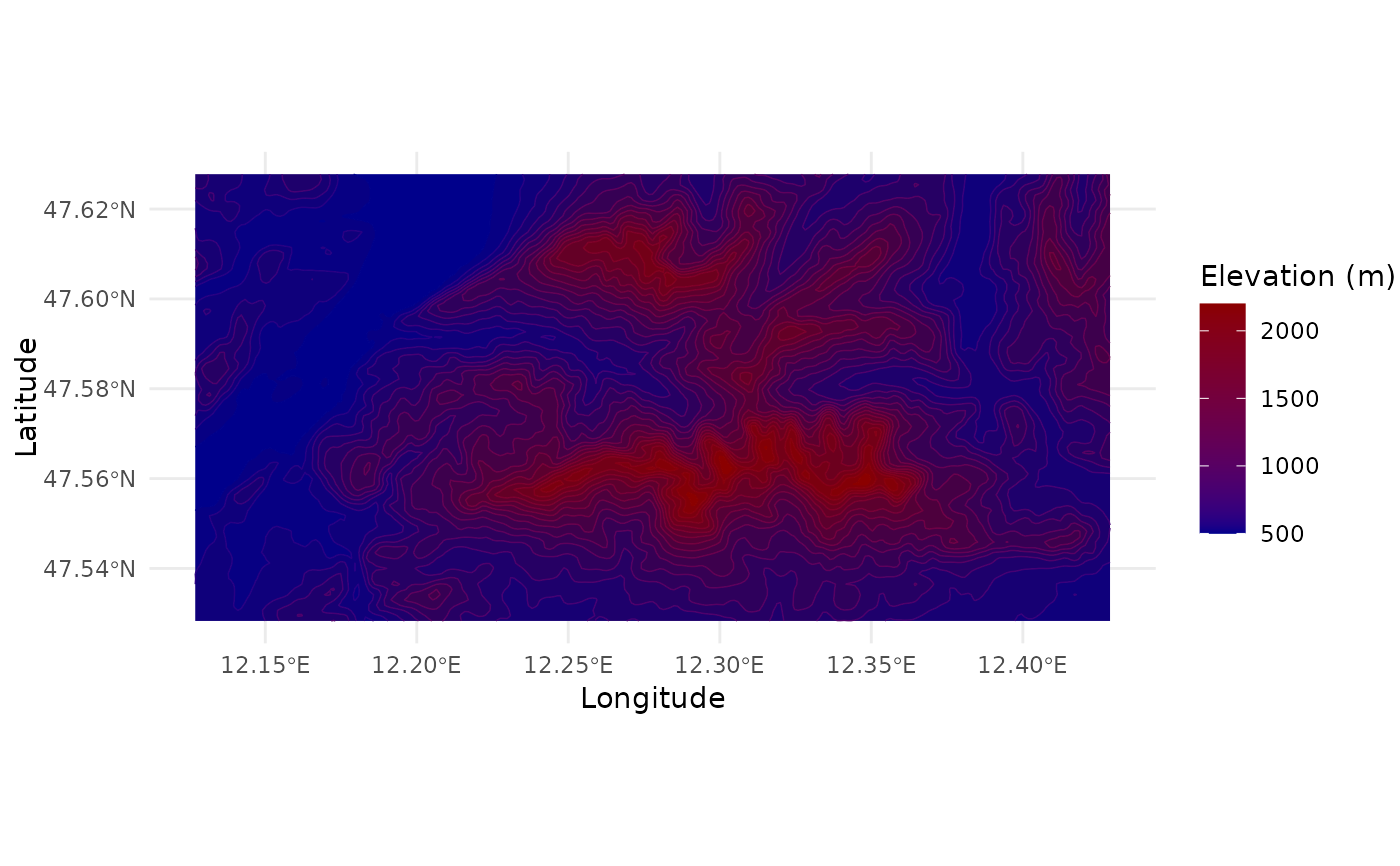
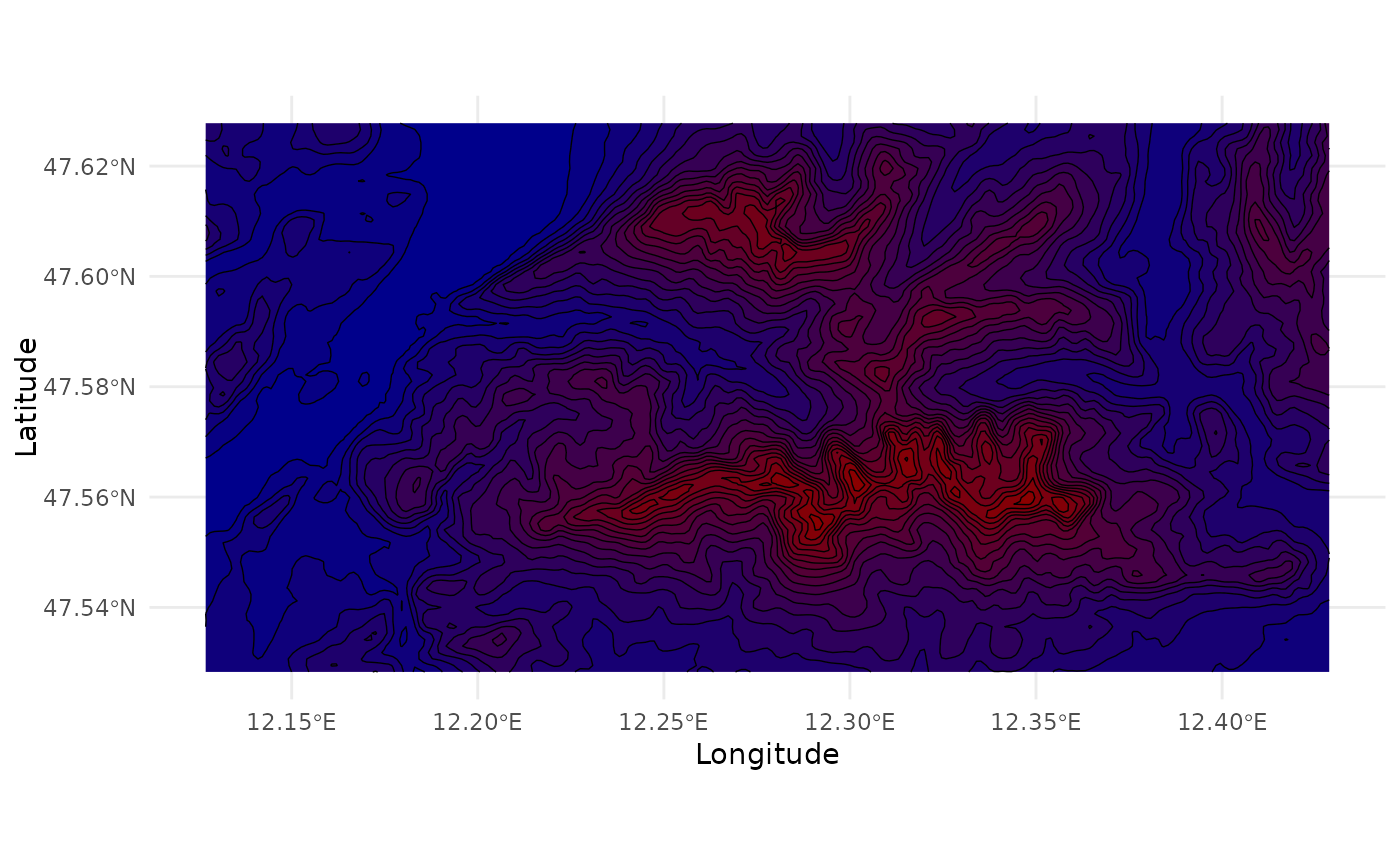 # Color both lines and fill by elevation
plot_contours(ele_wilder_kaiser, color_by_elevation = "both")
# Color both lines and fill by elevation
plot_contours(ele_wilder_kaiser, color_by_elevation = "both")