How to use Quarto to create Open & Reproducible Presentations
Digital Research Academy Train the Trainer program
![]()
![]()

February 13, 2024
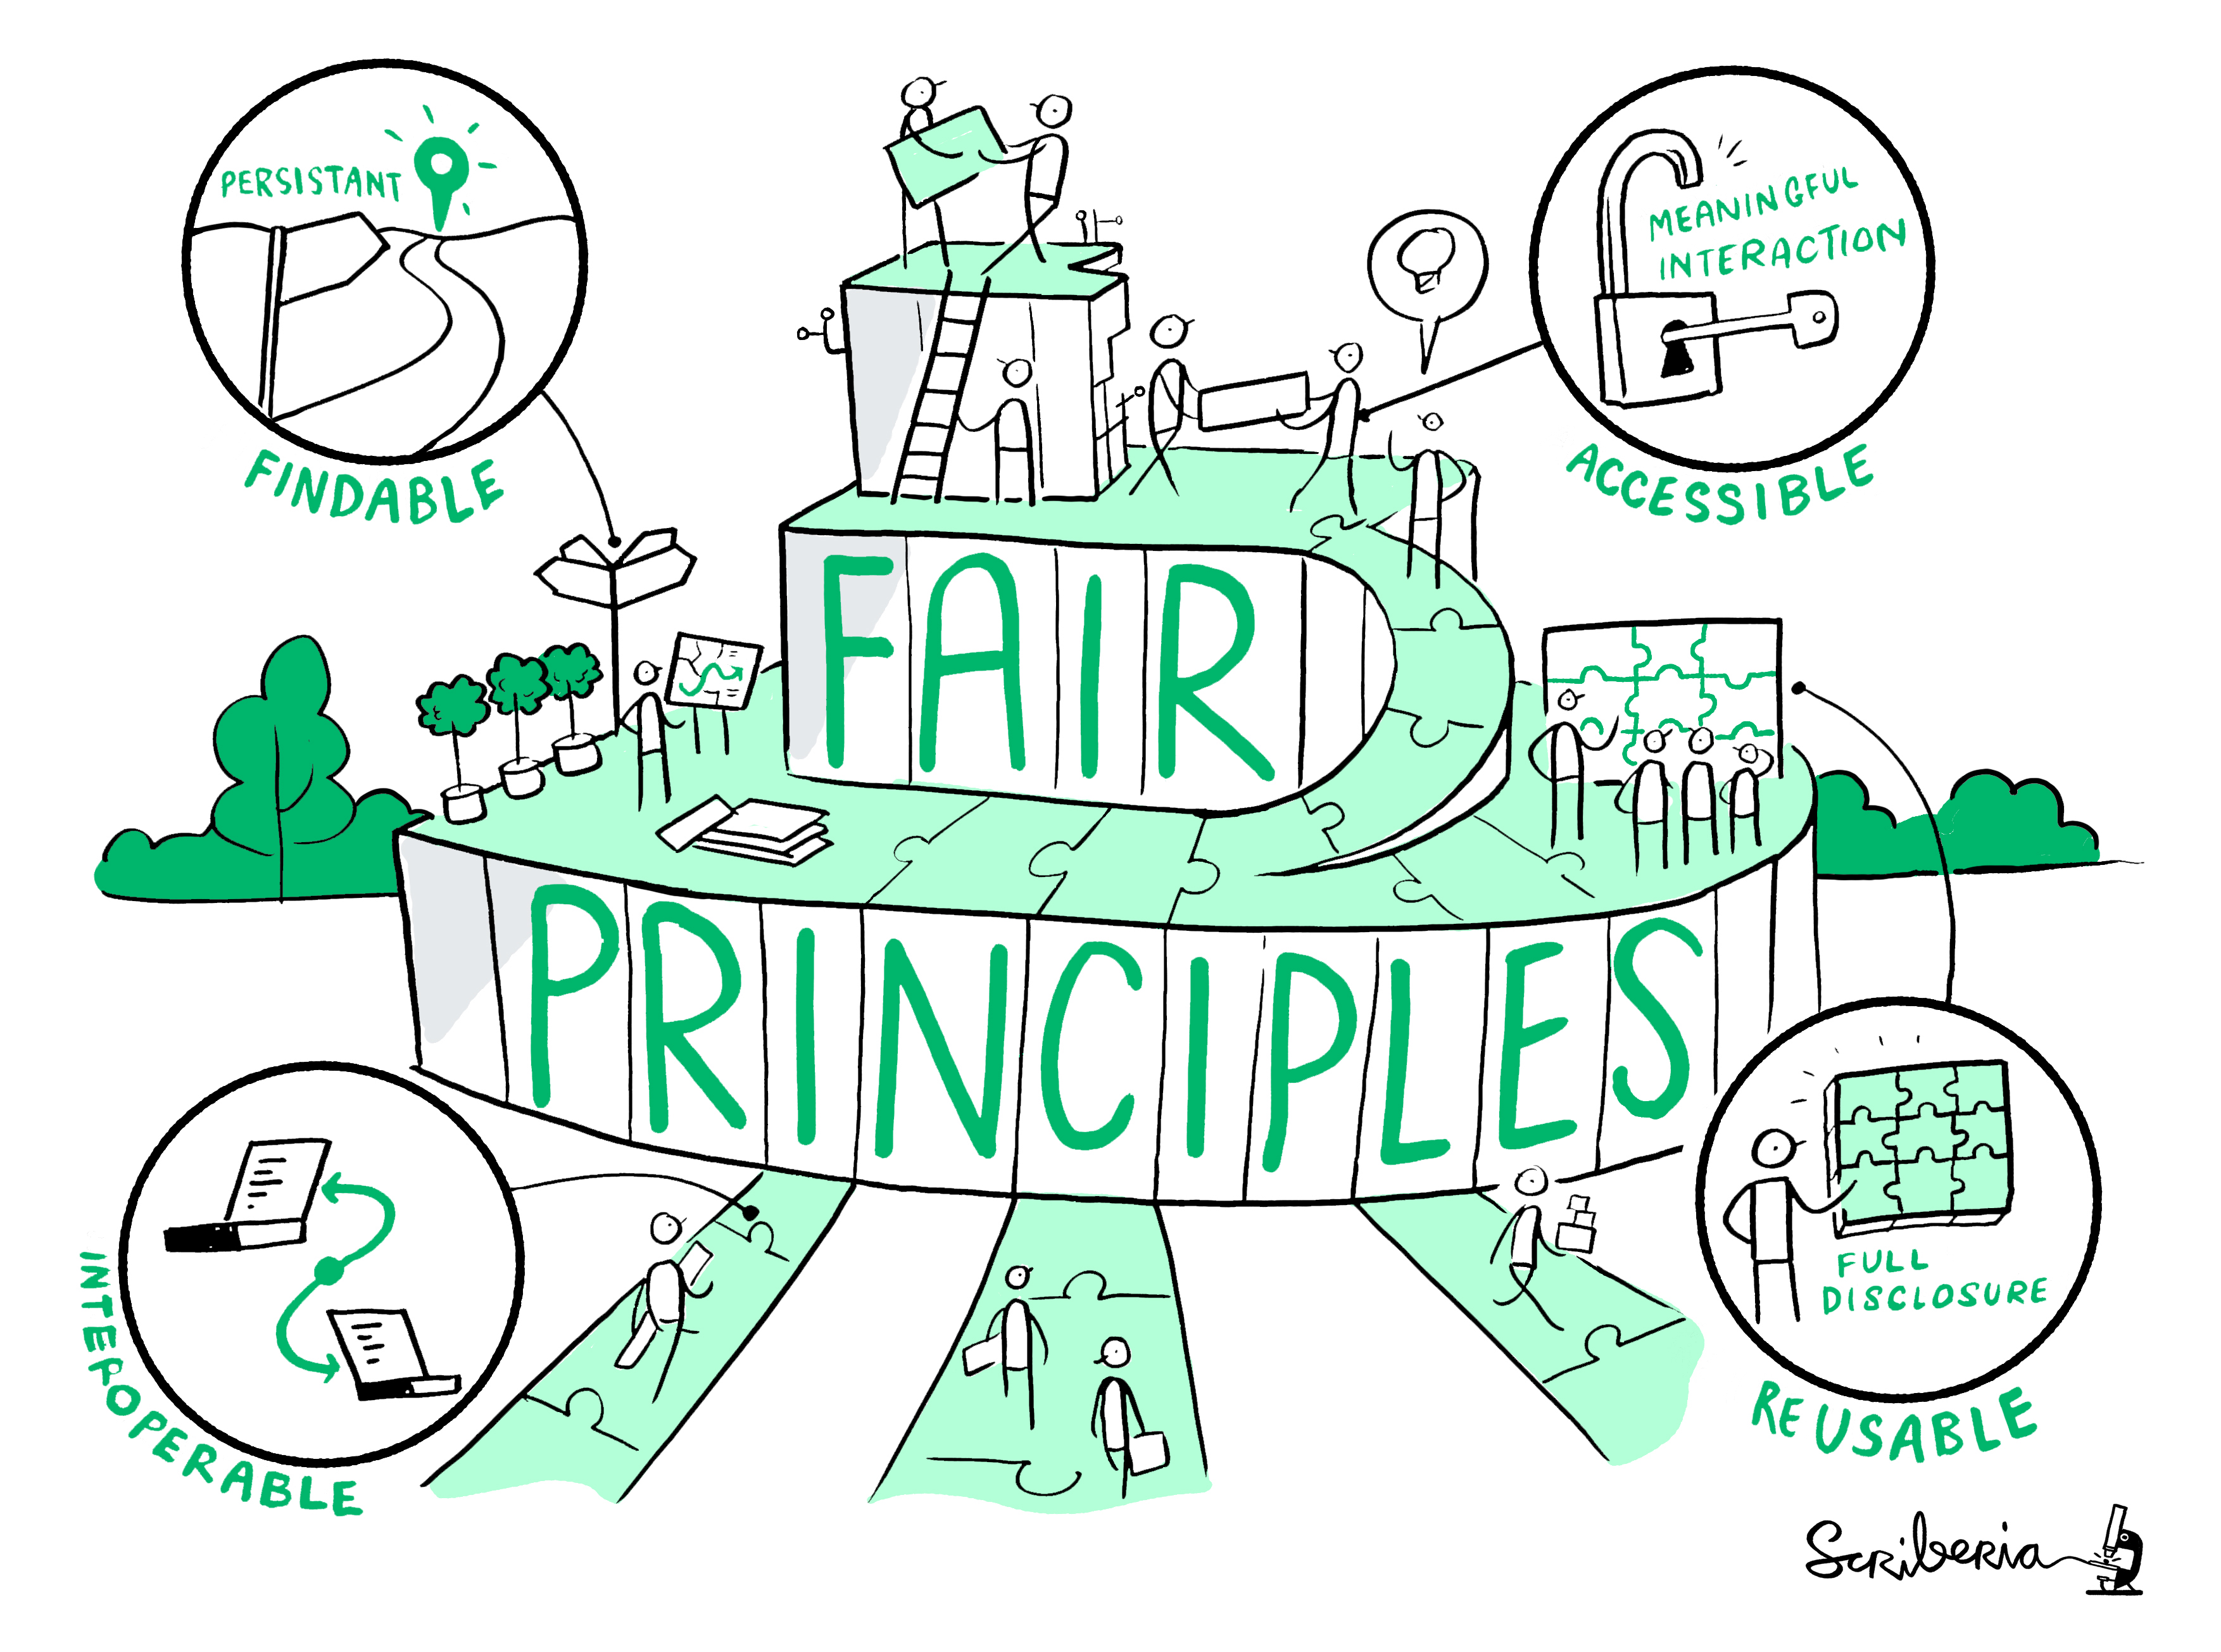
What are FAIR Principles?
Findable
- Descriptive metadata and persistent identifier (DOI)
Accessible
- Data could be openly available OR access via authentication and if needed
Interoperable
- Data needs to be integrated with other data and interoperate with applications or workflows (Open formats)
Reusable
- Documentation and license (Open license - e.g. Creative Commons)
What is Reproducibility?
“[…] when the same analysis steps performed on the same dataset […] produce the same answer.” (Turing Way)

FAIR and reproducible training materials are beneficial to you!
- Information sheets saves time in sharing information
- Clear communication (or you can update the information!)
- Saves time in on-boarding/re-using materials
- Preserved & Findable
- Easy to share within and outside your team
- Provides you and collaborators with credit (visibility, DOI, citations)

FAIR and reproducible training materials are beneficial to us!
- FAIR and reproducible training materials are beneficial to Nick, Jan and Unai 😀
- We used the Reproducible and FAIR Teaching Materials slides from the Aug 2023 Train the Trainer programme
- Thank you very much to Esther Plomp and Lennart Wittkuhn 🙏 whose Quarto slides we used and developed!


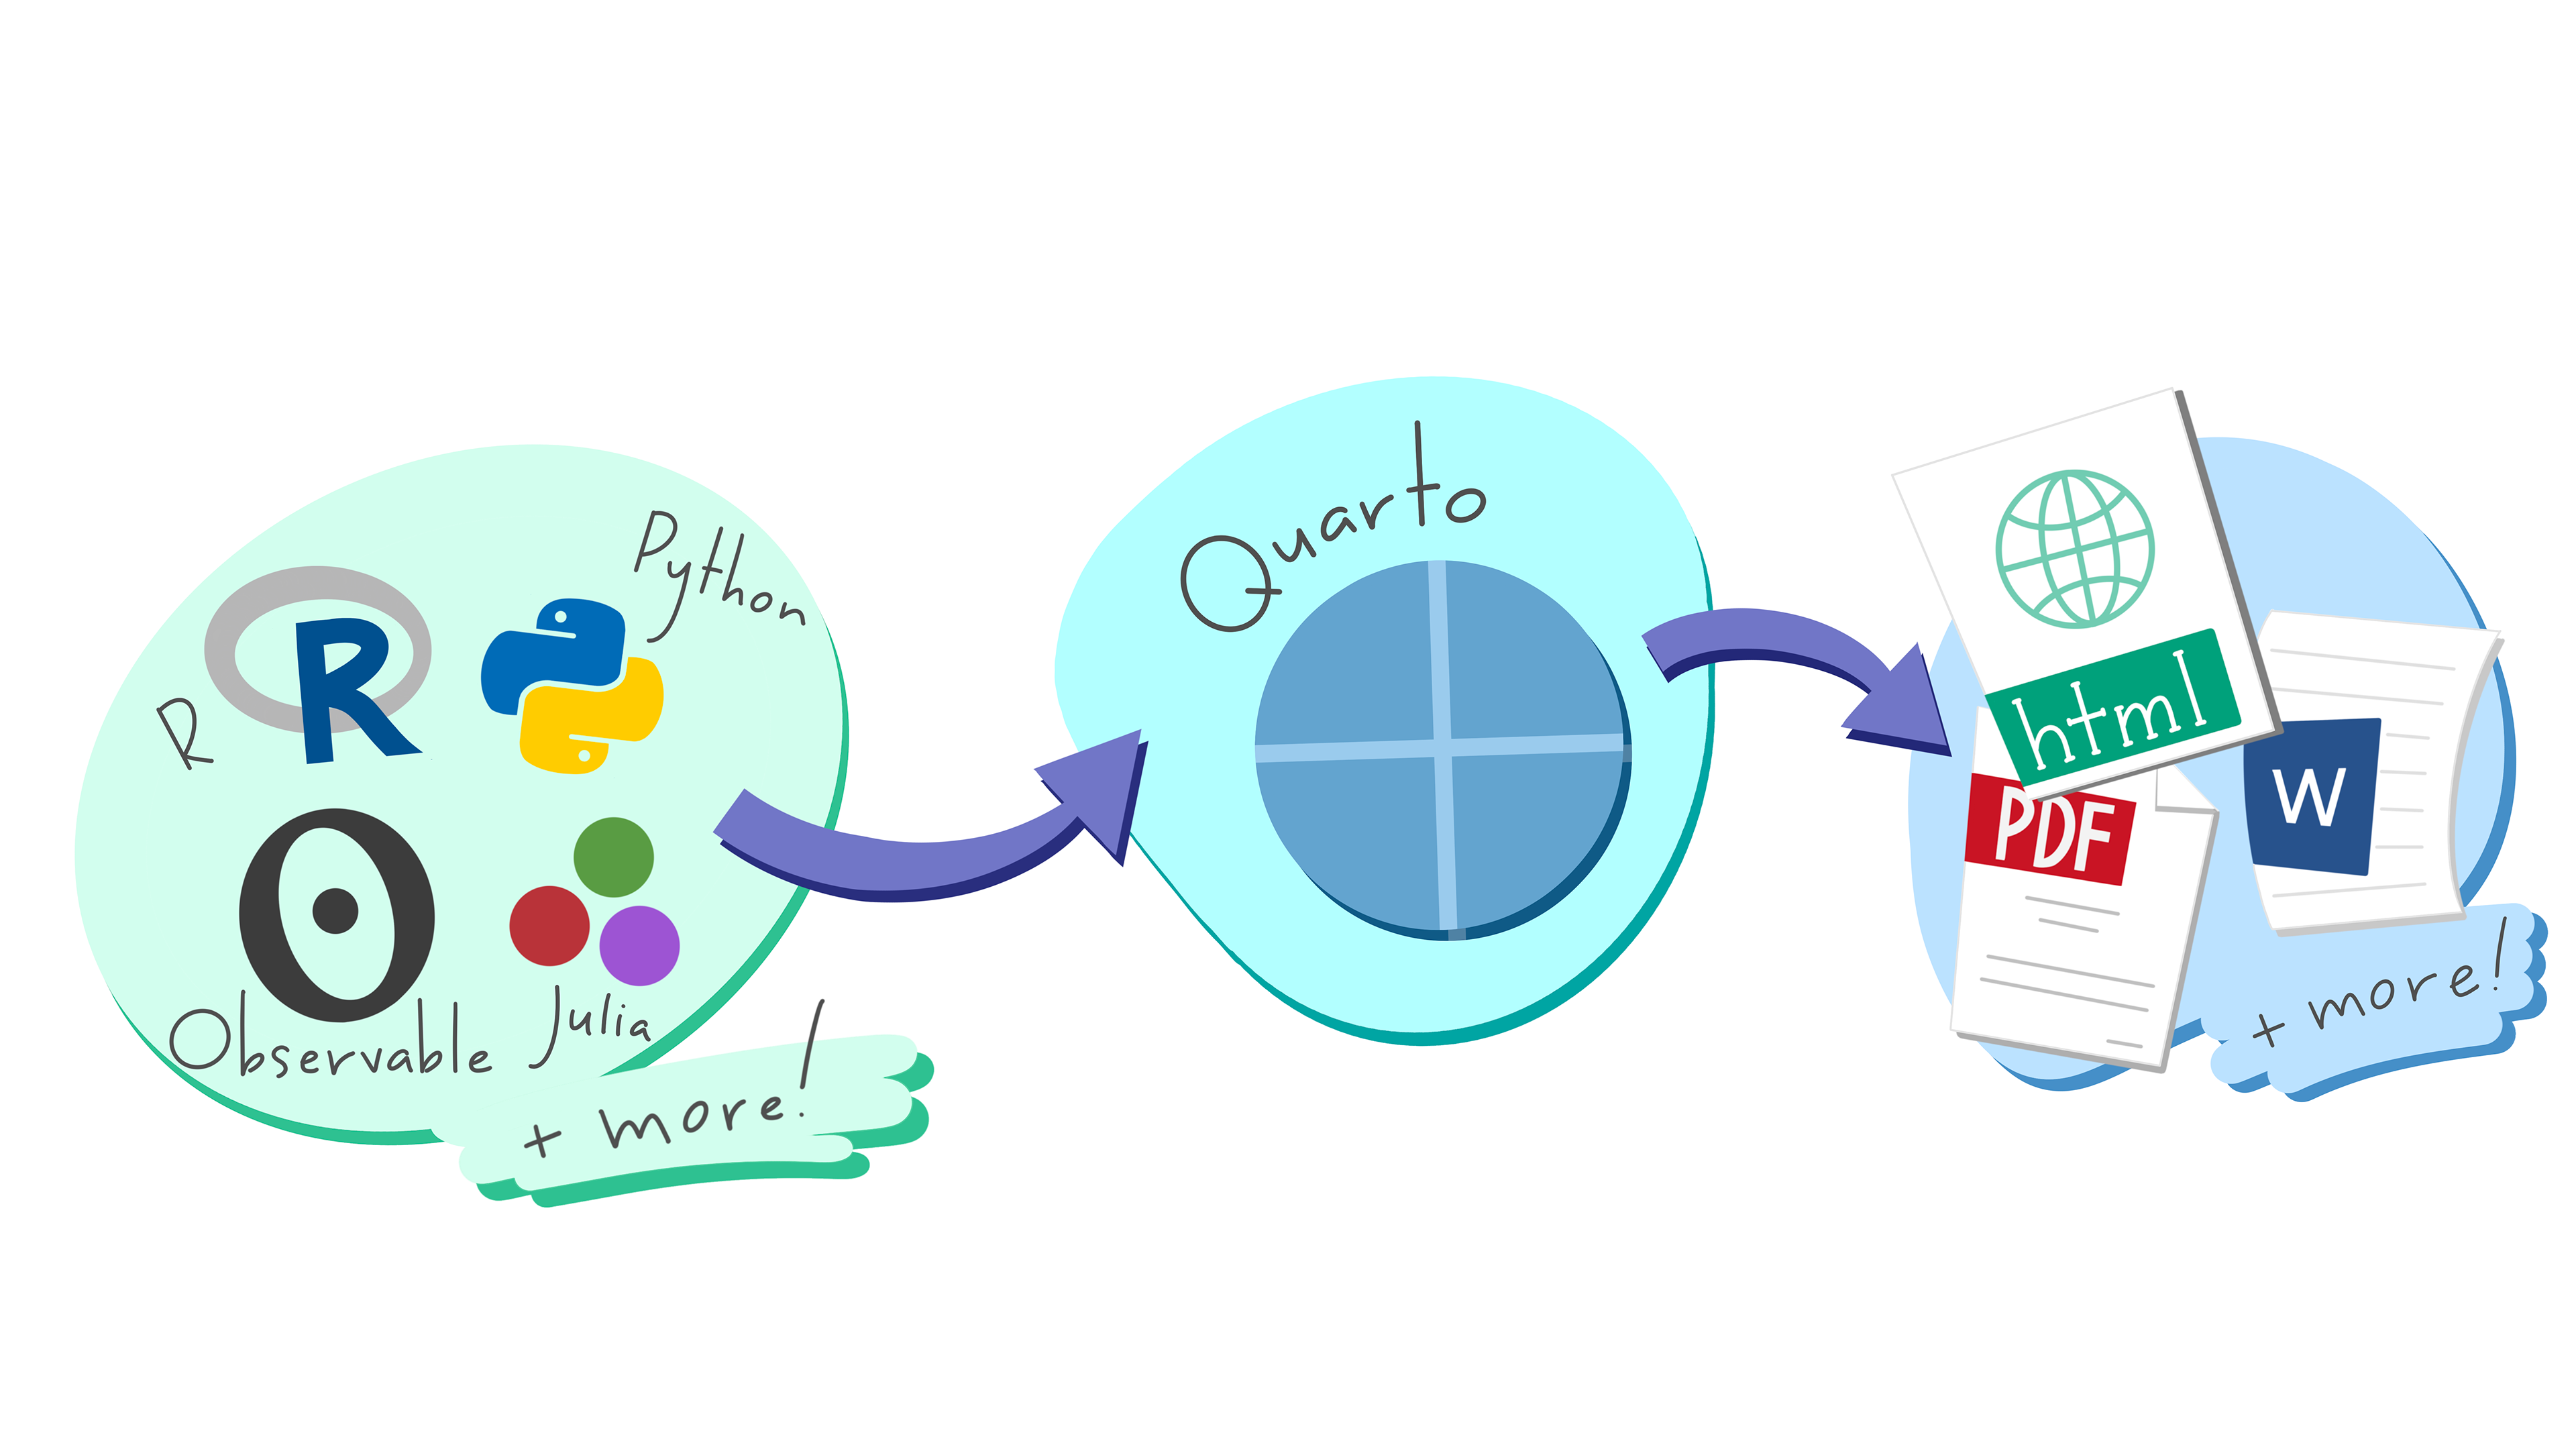
About Quarto
- Quarto is a new, open-source, scientific and technical publishing system
- Combine text and code to produce formatted documents
- Publish reproducible and dynamic presentations, dashboards, websites, blogs, and books in HTML, PDF, MS Word, etc.
- Multi-language support for R, Python, Julia, and more
- Quarto extends RMarkdown and shares similarities with Juypter Notebooks.
Formats
- Documents: HTML, PDF, MS Word, Open Office, ePub
- Presentations: Revealjs, PowerPoint,
- Wikis: MediaWiki, JiraWiki, …
- Many templates exist for academic documents: quarto-journals
- And much more: Jupyter, RTF, InDesign, …


How does Quarto work?

taken from What is Quarto - A Quick Intro FAQ
.qmd

.ipynb

Tools


Rendered Output

Code chunks

During the Break:
- Go to https://login.posit.cloud/
- Click Sign Up
![]()
- fill out form
- Click Sign Up
- Choose Posit Cloud
![]()
- verify email in your inbox

click Continue
Click New Project -> New RStudio Project
It should look like the image in the top right!


08:00
Demo 1
- This is your RStudio window:
Demo 2
- Choose: File > New File > Quarto Presentation…

give it a title, e.g. “Presentation”
click Create
this is your presentation

Demo 3
We are in Visual mode - you can type in and see changes in real time.
Slide list is on the right.
To add a slide, type in some text.
Set it to Header 2 - you will see it appear in the list.
Can do Visual mode or Source mode.
![]()
- You can make changes in either and both will update.

Demo 4
To see the slides we need to Render
This converts the Quarto code to slides you can look and and share (in HTML, you can also export as PDF).
Before we do this, we have an issue:
![]()
Click Install to install the library.
Then click
![]()
Slides will open in a new window.
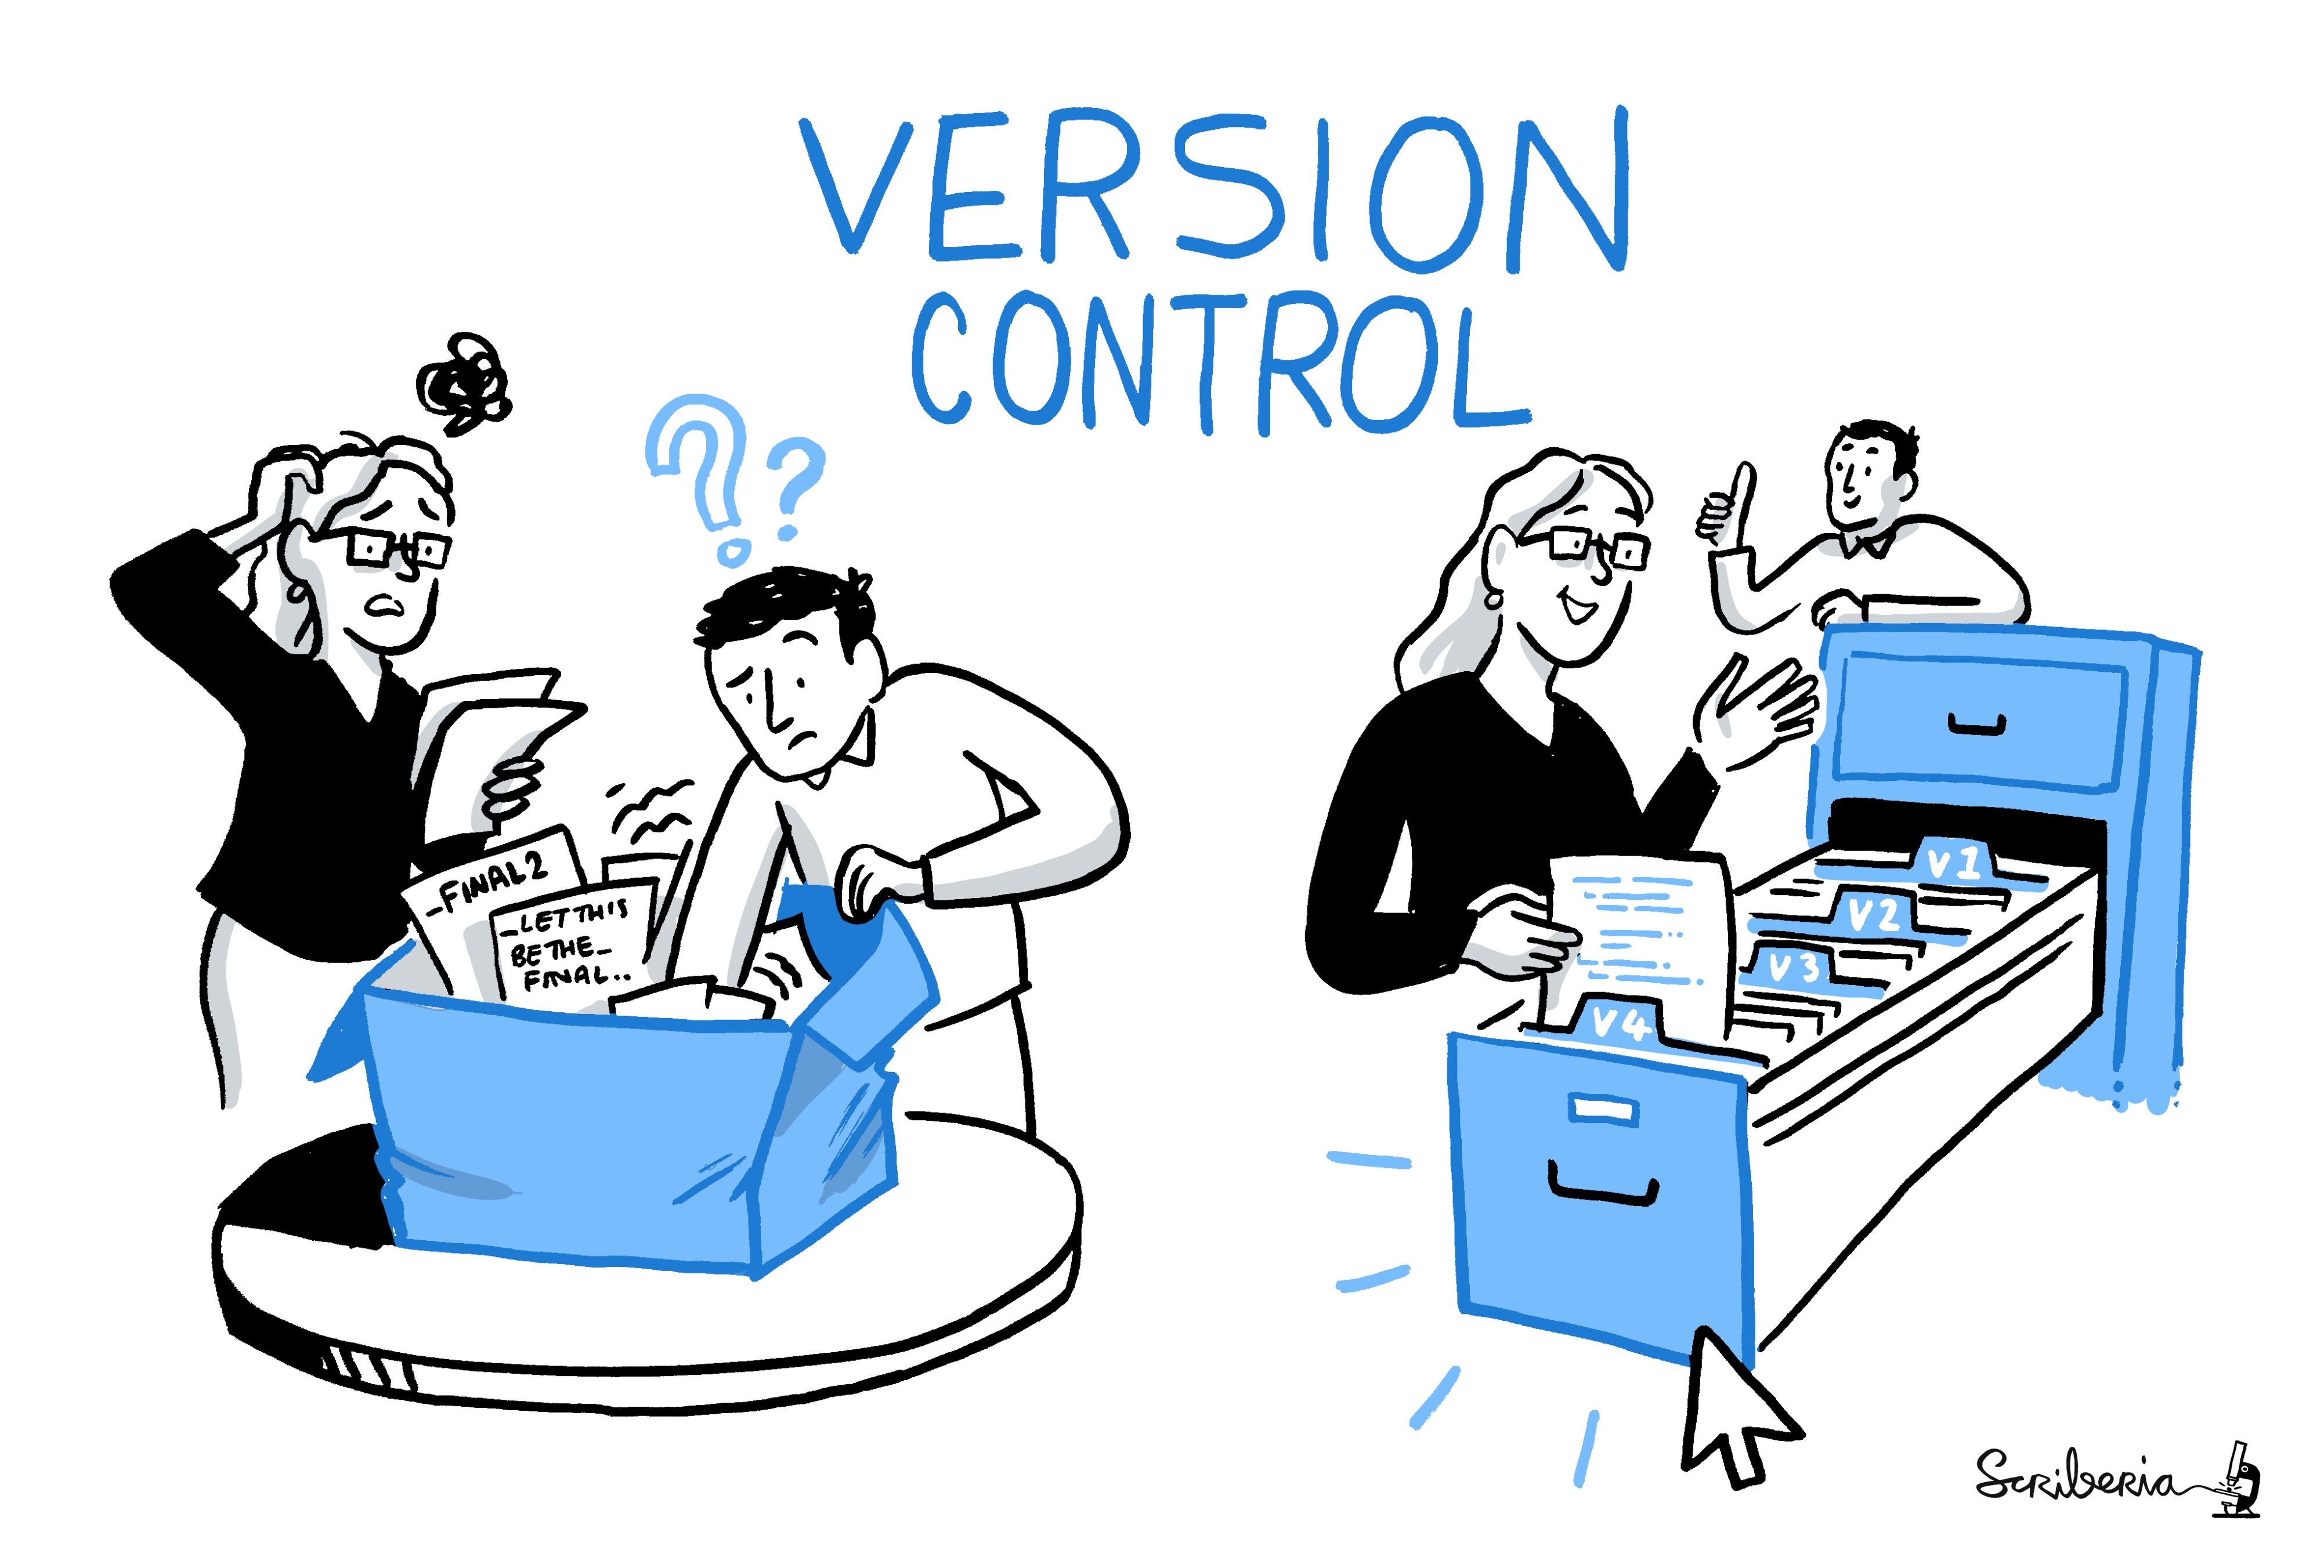
Key Benefit: (Explicit) Version Control

- Going back through time
- Great for collaboration
- Allow sharing and adaptation
- Just like this presentation
- Allows automation
Thank you! 🙏


Images: Scriberia with The Turing Way community (License: CC BY 4.0)
💻 Slides: Slides are publicly available at github.com/jansim/dra-reproducible-materials
📦 Software: Reproducible slides build with Quarto and deployed to GitHub Pages using GitHub Actions (details in the Quarto docs)
Source: Source code is available at github.com/jansim/dra-reproducible-materials
🖲️ DOI: ![]() (generated using GitHub + Zenodo, see GitHub docs)
(generated using GitHub + Zenodo, see GitHub docs)
License: Creative Commons Attribution 4.0 International (CC BY 4.0)
💬 Contact: We welcome any feedback via email or GitHub issues. Thank you!